8.5(B) Supporting: Represent linear non-proportional situations with tables, graphs, and equations in the form of y = mx + b, where b ≠ 0.
STAAR Released Tests Questions
Easy
Low
1.
1
Anita has a collection of postage stamps from different countries.
She has one book that contains 35 stamps. She has a second book
that has 7 stamps on each page. The equation below can be used to
find t, the total number of postage stamps Anita has if the second
book has p pages.
t = 35 + 7p
How many postage stamps does Anita have in all if the second book has 14 pages?
Answer: 133
Medium
Low
2.
1
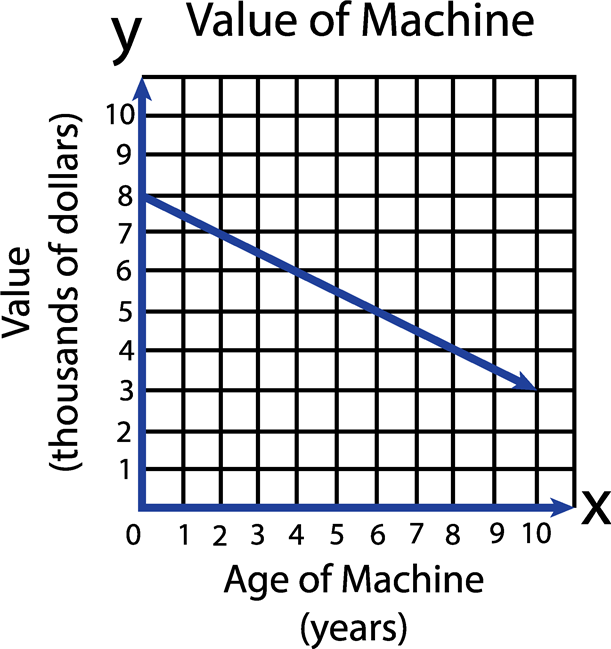
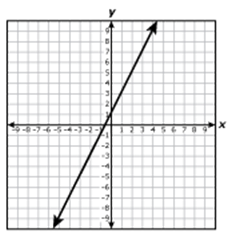
The graph models the value of a machine over a 10-year period.
Which equation best represents the relationship between x, the age of the machine in years, and y, the value of the machine in dollars over this 10-year period?
A
y= -0.002x + 2,500
B
y= −500x + 8,000
C
y= 500x + 8,000
D
y= 0.002x + 2,500
Answer: B
Easy
Low
3.
1
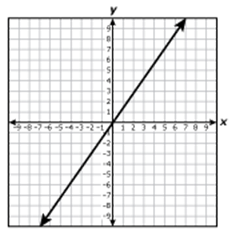
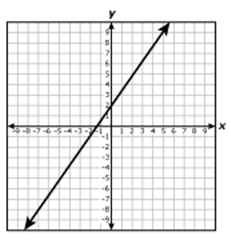
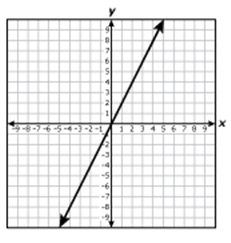
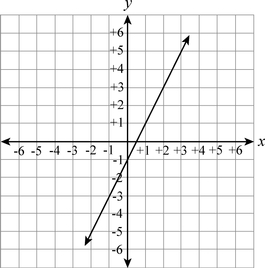
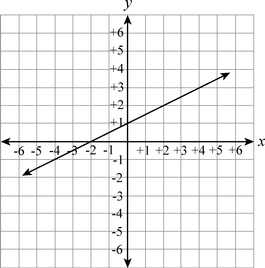
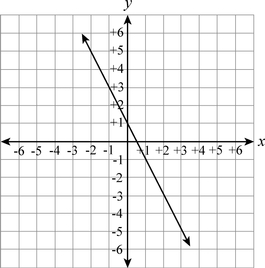
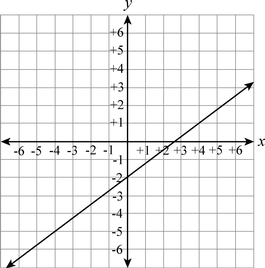
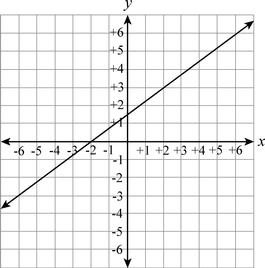
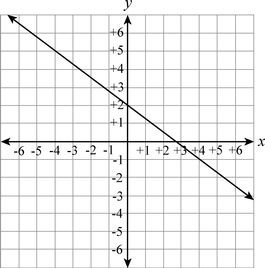
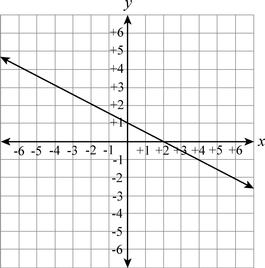
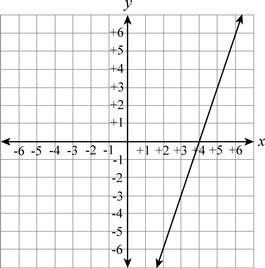
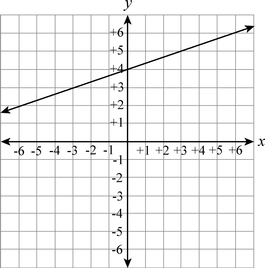
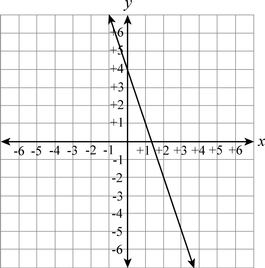
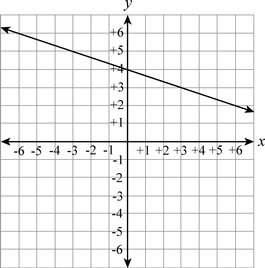
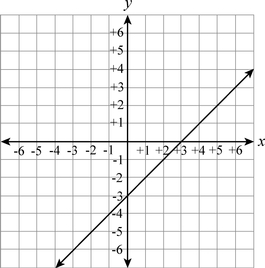
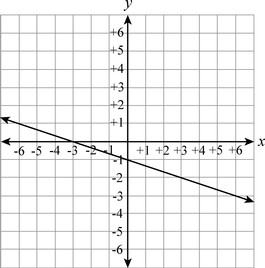
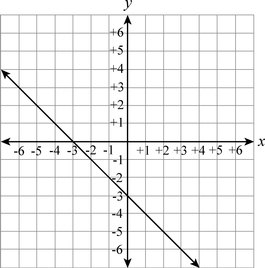
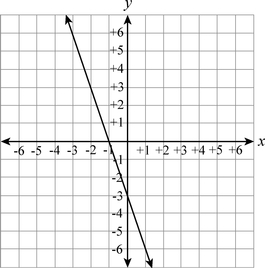
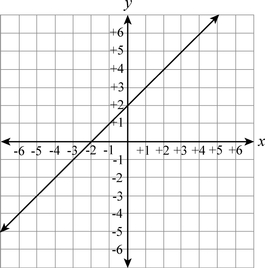
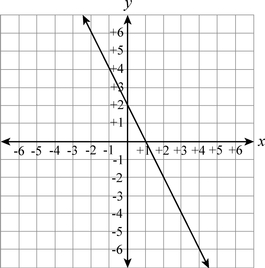
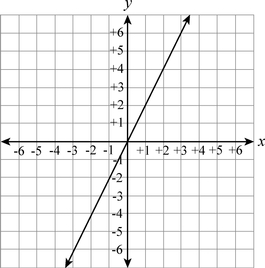
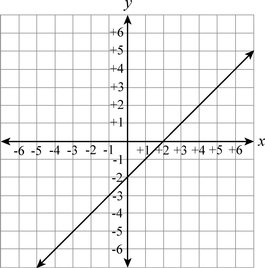
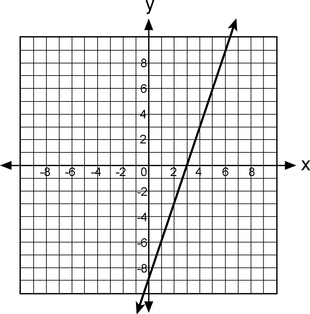
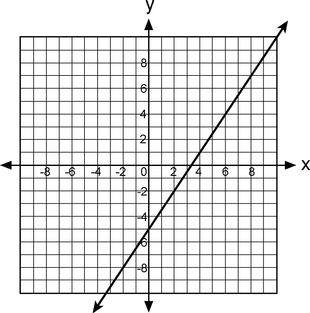
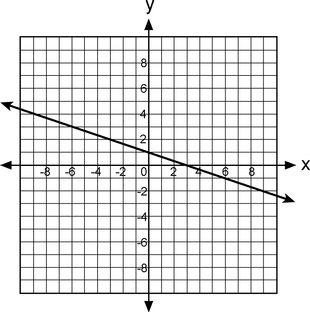
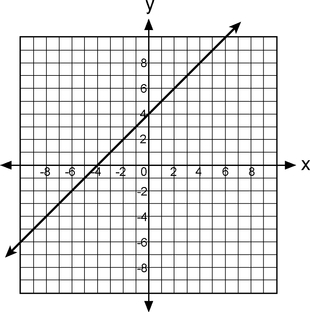
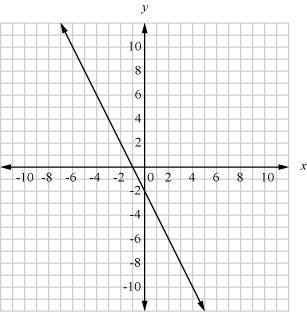
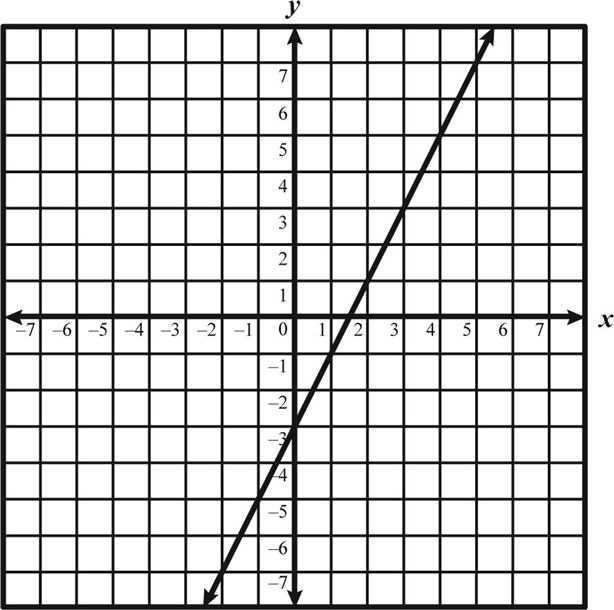
Which graph best represents the equation y = 1.4x + 2?
A
B
C
D
Answer: B
Easy
Low
4.
1
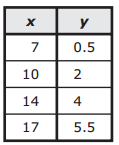
Which table contains only corresponding x-values and y-values where the value of y is 3 more than the quotient of x and 2?
A
B
C
D
Answer: B
Practice Questions
N/A
Medium
1.
1
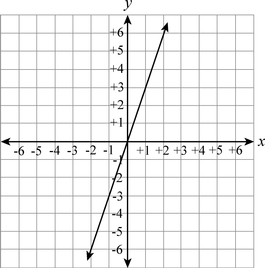
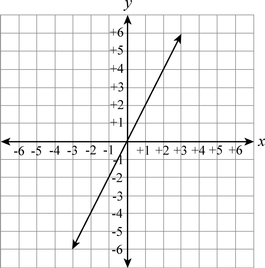
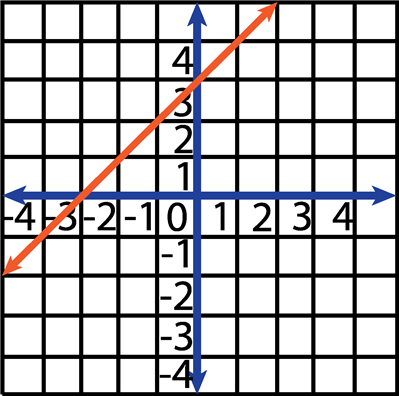
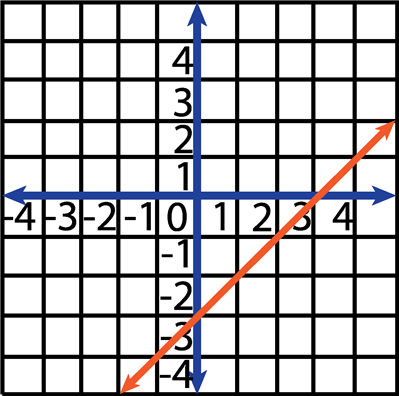
Which is the graph of the equation y = 3x?
A
B
C
D
Answer: D
N/A
Medium
2.
1
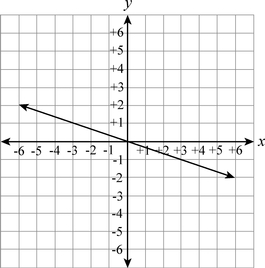
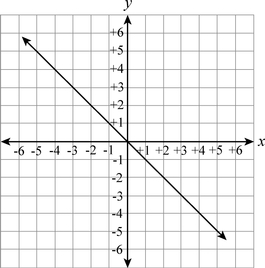
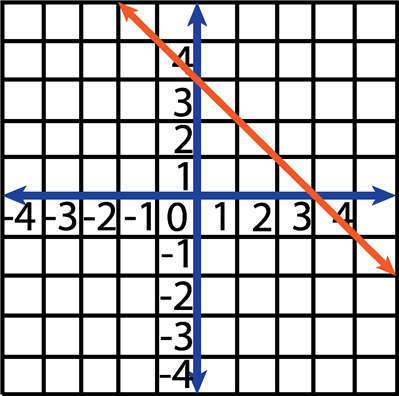
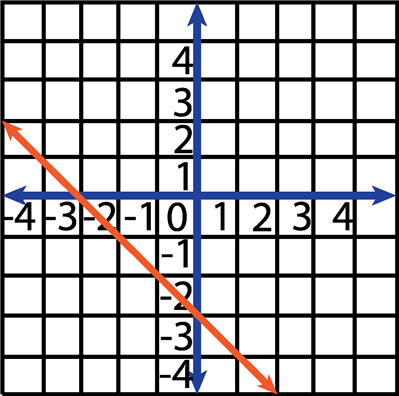
Which is the graph of the equation y = −x?
A
B
C
D
Answer: B
N/A
Medium
3.
1
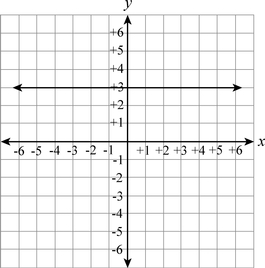
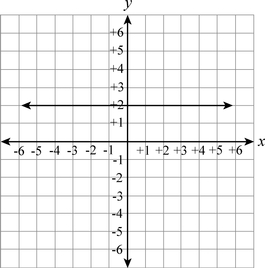
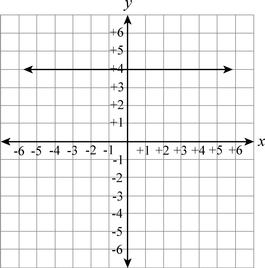
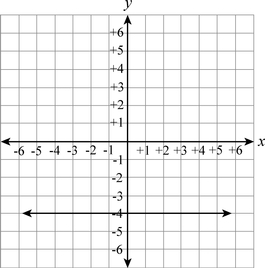
Which is the graph of the equation y = 2?
A
B
C
D
Answer: C
N/A
Medium
4.
1
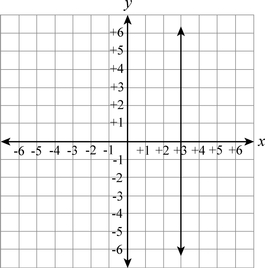
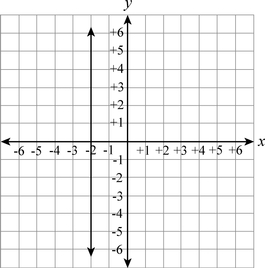
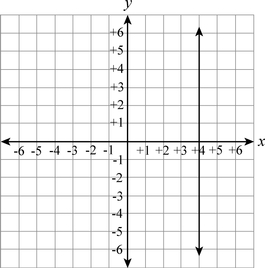
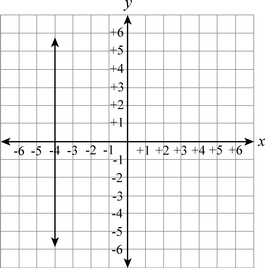
Which is the graph of the equation x = 4?
A
B
C
D
Answer: C
N/A
Medium
5.
1
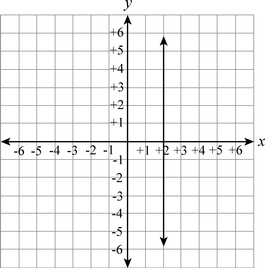
Which is the graph of the equation x = −4?
A
B
C
D
Answer: B
N/A
Medium
6.
1
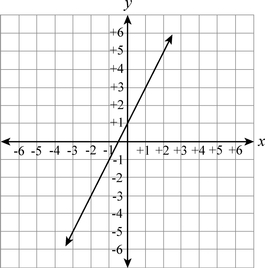
Which is the graph of the equation y = 2x + 1?
A
B
C
D
Answer: A
N/A
Medium
7.
1
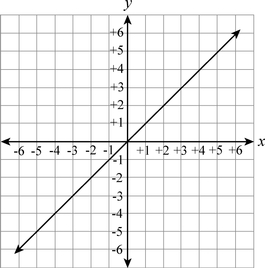
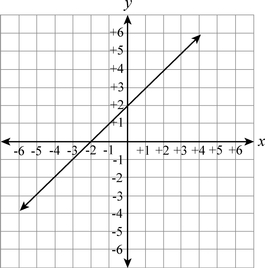
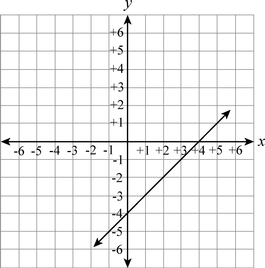
Which is the graph of the equation y = x − 2?
A
B
C
D
Answer: A
N/A
Medium
8.
1
Which is the graph of the equation ?
A
B
C
D
Answer: B
N/A
Medium
9.
1
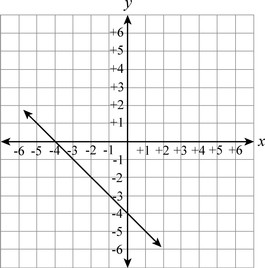
Which is the graph of the equation y = −x − 3?
A
B
C
D
Answer: C
N/A
Medium
10.
1
Which is the graph of the equation y = −2x + 2?
A
B
C
D
Answer: B
N/A
Medium
11.
1
The graph of a line is shown on the grid below.
Which table of ordered pairs represents the same linear equation shown on the graph?
A
x
y
1
‒5
2
‒2
4
2
6
6
B
x
y
1
‒6
2
‒3
4
3
5
6
C
x
y
2
‒3
3
0
4
‒3
5
‒6
D
x
y
‒3
2
0
3
3
4
6
5
Answer: B
N/A
Medium
12.
1
The graph of a line is shown on the grid below.
Which table of ordered pairs represents the same linear equation shown on the graph?
A
x
y
‒5
0
‒2
2
1
4
4
6
B
x
y
‒1
‒6
1
‒3
3
0
5
3
C
x
y
0
5
2
2
4
‒1
6
‒4
D
x
y
0
‒5
2
‒2
4
1
6
4
Answer: D
N/A
Medium
13.
1
The graph of a line is shown on the grid below.
Which table of ordered pairs represents the same linear equation shown on the graph?
A
x
y
‒5
3
‒1
1
2
0
5
‒1
B
x
y
6
‒1
0
1
3
2
6
3
C
x
y
‒6
3
‒3
2
0
1
3
0
D
x
y
2
‒3
1
0
0
3
‒1
6
Answer: C
N/A
Medium
14.
1
The graph of a line is shown on the grid below.
Which table of ordered pairs represents the same linear equation shown on the graph?
A
x
y
‒3
0
‒1
2
1
4
2
5
B
x
y
‒5
‒1
‒3
1
‒1
3
1
5
C
x
y
0
‒4
2
‒2
4
0
6
2
D
x
y
‒4
0
0
4
2
2
4
0
Answer: B
N/A
Medium
15.
1
Which of the following tables represents the relationship between x and y in the equation y = 5x − 8?
A
x
y
5
‒3
10
2
15
7
20
12
B
x
y
0
8
1
3
2
‒2
3
‒7
C
x
y
2
2
4
12
6
11
8
32
D
x
y
8
5
16
10
24
15
32
20
Answer: C
N/A
Medium
16.
1
Which of the following tables represents the relationship between x and y in the equation 2x + 3y = 30?
A
x
y
3
8
6
6
9
4
12
2
B
x
y
10
3
6
6
2
8
1
9
C
x
y
0
10
2
7
4
4
6
1
D
x
y
0
10
6
6
12
2
18
2
Answer: A
N/A
Medium
17.
1
Which of the following tables represents the relationship between x and y in the equation x − 7y = 1?
A
x
y
1
0
8
1
16
2
24
3
B
x
y
4
3
5
2
6
1
7
0
C
x
y
1
0
8
1
15
2
22
3
D
x
y
7
1
14
2
21
3
28
4
Answer: C
N/A
Medium
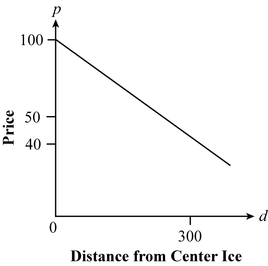
18.
1
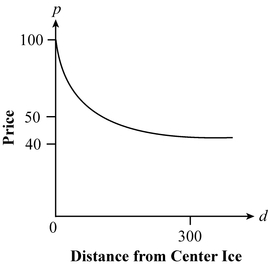
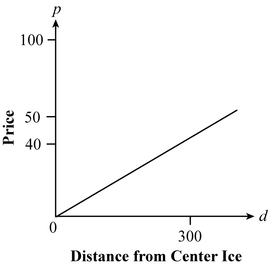
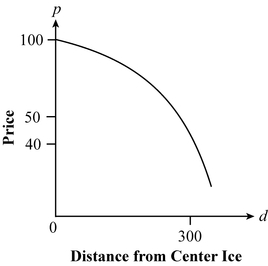
Icebox Arena
calculates ticket prices for hockey games using a special formula. The
price of each ticket starts at $100, but a discount is given based on
how far from center ice each seat is located. A discount of 20 cents per
foot away from center ice is given for each ticket. Which graph best
illustrates the price of hockey tickets at Icebox Arena?
A
B
C
D
Answer: A
N/A
Medium
19.
1
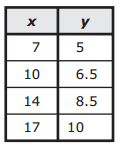
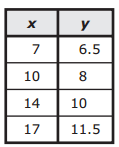
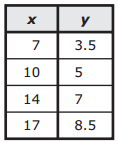
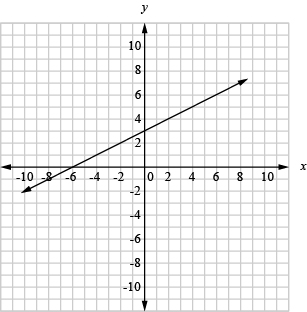
The graph of a line is shown on the grid below.
Which table of ordered pairs represents the same linear equation shown on the graph?
A
x
y
0
3
2
4
4
5
6
6
8
7
B
x
y
1
4
3
5
5
6
7
7
9
8
C
x
y
−2
−10
−1
−8
0
−6
1
−4
2
−2
D
x
y
−4
−1
−2
−2
0
−3
2
−4
4
−5
Answer: A
N/A
Medium
20.
1
The graph of a line is shown on the grid below.
Which table of ordered pairs represents the same linear equation shown on the graph?
A
0
2
1
4
2
6
3
8
4
10
B
0
−2
1
0
2
2
3
4
4
6
C
−2
2
−1
0
0
−2
1
−4
2
−6
D
−6
2
−2
0
2
−2
6
−4
10
−6
Answer: C
Easy
Low
21.
1
Which table shows a NON-PROPORTIONAL relationship?
A
x
y
4
7
6
12
10
23
B
x
y
4
12
5
15
6
18
C
x
y
2
3
3
4.5
4
6
D
x
y
200
300
40
60
20
30
Answer: A
Medium
Medium
22.
1
Which table shows a non-proportional relationship?
A
x
y
4
8
6
12
10
20
B
x
y
3
9
6
18
9
27
C
x
y
2
7
3
14
4
21
D
x
y
20
30
4
6
2
3
Answer: C
Hard
High
23.
1
The drama club created a play for theatre arts. They spent a total of $100 for scenery and props. The equation below shows y, the amount of profit that the club will take in if they sell x number of tickets for $5 each.
y = 5x − 100
A. Fill in the table of values for the equation above.
x
y
0
10
20
30
40
50
B. In the grid below, graph the equation y = 5x − 100.
Answer: 1 to 3
Medium
Medium
24.
1
In the grid below, graph the following linear equation: y = −x − 3.
Answer: 0 to 1
Medium
Medium
25.
1
Which of these equations represents the graph below?
A
y = x2 + 3
B
y = 2x − 3
C
y = 2x + 3
D
y = x2 − 3
Answer: B
Medium
Medium
26.
1
Which of these graphs best represents the equation y = x + 3?
A
B
C
D
Answer: A
Medium
Medium
27.
1
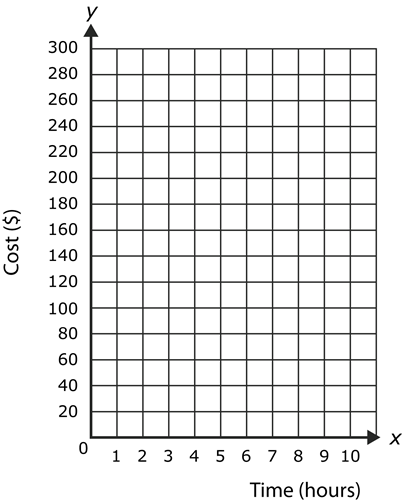
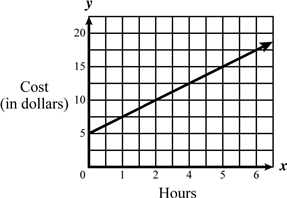
The graph below shows the cost of renting a bicycle at a recreation center.
A. According to the graph, what does the coordinates (0, 5) represent?
B. Fill in the table below using the data shown in the graph.
Bicycle Rentals
Hours
Cost
1
2
3
4
5
6
C. What would the cost be to rent a bicycle for hours?
Answer: 1 to 3
Medium
Low
28.
1
Which of the following tables can be generated from the equation y = 2x + 3?
A
x
y
2
1
3
2
4
3
5
4
B
x
y
0
1
1
2
2
3
3
4
C
x
y
1
3
2
5
3
7
4
9
D
x
y
0
3
1
5
2
7
3
9
Answer: D
Medium
Low
29.
1
Which of the following tables can be generated from the equation y = x + 1?
A
x
y
2
1
3
2
4
3
5
4
B
x
y
0
1
1
2
2
3
3
4
C
x
y
1
3
2
5
3
7
4
9
D
x
y
0
3
1
5
2
7
3
9
Answer: B
Easy
Medium
30.
1
The table below indicates a linear relationship between x and y.
x
y
2
5
4
9
6
13
12
25
Which equation would generate the values in this table?
A
y = x + 3
B
y = 3x − 1
C
y = 2x + 1
D
y = 7 − x
Answer: C
Easy
Medium
31.
1
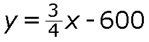
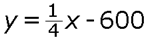
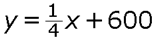
George bought a new motorcycle at an auction. He paid of the original price x, and received an additional discount of $600. Which of the following equations represents y, the price George paid for the motorcycle?
A
B
C
D
Answer: A
Hard
High
32.
1
Jessica wants to go on a school trip next month. The trip will cost
$100 and she already has $10 and plans to babysit for $5 an hour to earn
the rest of the money.
A. Write an equation that could be used to determine h, the number of hours Jessica needs to babysit to earn $100.
B. From your equation, determine the number of hours she needs to babysit.
Answer: 0 to 2
Medium
Medium
33.
1
George bought a new motorcycle at an auction. He paid75% of the original price, x, and received an additional discount of $600. Which of the following equations represents y, the price George paid for the motorcycle?
A
B
C
D
Answer: A
Medium
Medium
34.
1
Jill worked five hours less than three times the number of hours that
Karen worked. Which of the following equations represents the
relationship between j, the number of hours that Jill worked and k, the number of hours that Karen worked?
A
j = 3k − 5
B
C
j = 3k + 5
D
Answer: A
Easy
Low
35.
1
Which of the following tables can be generated from the equation y = 2x + 1?
A
x
y
2
1
3
2
4
3
5
4
B
x
y
−4
1
−2
−1
0
−3
2
−5
C
x
y
1
3
2
5
3
7
4
9
D
x
y
0
3
1
5
2
7
3
9
Answer: C
Medium
Medium
36.
1
Which of the following tables contains values that satisfy the equation ?
A
X
Y
−1
0
1
B
X
Y
−1
0
1
C
X
Y
−1
0
1
D
X
Y
−1
0
1
Answer: D
Medium
Low
37.
1
Which of the following tables can be generated from the equation y = 2x + 3?
A
x
y
2
1
3
2
4
3
5
4
B
x
y
0
1
1
2
2
3
3
4
C
x
y
1
3
2
5
3
7
4
9
D
x
y
0
3
1
5
2
7
3
9
Answer: D
Hard
High
38.
1
The cost of a moving van varies depending on the number of hours. To
rent the van it costs $50 plus $30 per hour. Graph this situation on the
coordinate plane below.


 of the original price x, and received an additional discount of $600. Which of the following equations represents y, the price George paid for the motorcycle?